Coase Theorem
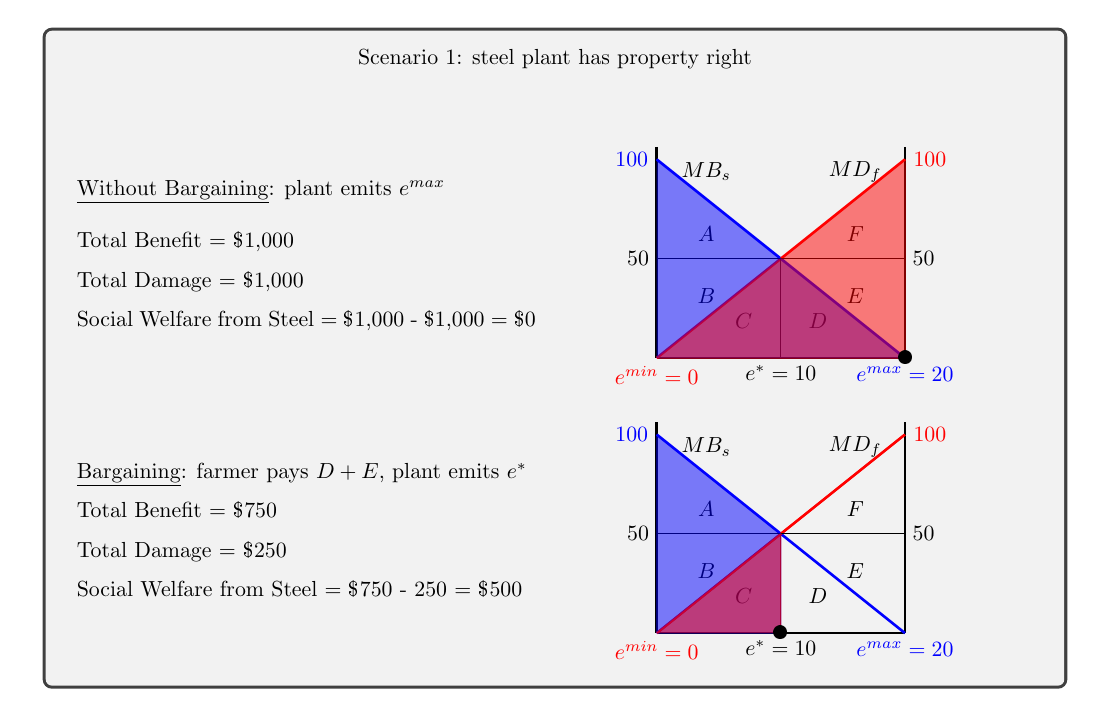
Here’s a nifty looking Coasian graph I came up with. Pretty straightforward and colorful!
Here is just the code for the graphs. For the full code inside the box and using \minipage: https://github.com/EconoTodd/LaTeX_code/blob/master/coase
\begin{tikzpicture}[scale=0.65]
\draw [very thick] (-5,0) -- (5,0);
\node at (-3,7.5) {$MB_{s}$};
\draw [very thick] (-5,8.5) -- (-5,0);
\node at (3, 7.5) {$MD_{f}$};
\draw [very thick] (5,8.5) -- (5,0);
\draw [very thick, color=blue] (-5,8) node [left] {100} -- (5,0) node[below] {$e^{max}=20$};
\draw [very thick, color=red] (-5,0) node [below] {$e^{min}=0$} -- (5,8) node [right] {100};
\draw [] (-5,4) node [left] {$50$} -- (5,4) node [right] {$50$};
\draw [] (0,4) -- (0,0) node[below] {$e^{*}=10$} ;
\node at (-3, 5) {$A$};
\node at (-3, 2.5) {$B$};
\node at (3, 5) {$F$};
\node at (3, 2.5) {$E$};
\node at (1.5, 1.5) {$D$};
\node at (-1.5, 1.5) {$C$};
\end{tikzpicture}


